Glossary · Execution
Timeframe alignment
Timeframe alignment means checking that the trend on a higher timeframe points the same way as the timeframe you enter on. If the daily and 4-hour charts are both making higher highs and higher lows, a buy on the 1-hour chart is aligned; a sell there is trading against the larger move.
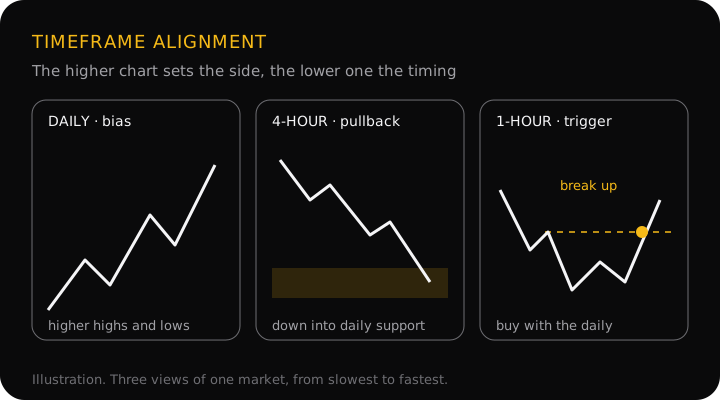
How to check alignment
- Read the higher timeframe first. Mark its swing highs and lows and decide whether it is an uptrend, a downtrend or a range, as the market structure page explains. That is your bias.
- Find where the higher timeframe would care. Its last higher low in an uptrend, a demand zone, an order block. Those are the places to look for trades in the bias direction.
- Drop to the entry timeframe and wait. When price reaches that area, look for the entry chart to turn back with the bias, for example a change of character in the higher timeframe's direction. Until then, a move against the bias on the entry chart is usually just the pullback.
A common rule of thumb is to make the higher timeframe about four to six times the entry one (daily and 4-hour, 4-hour and 1-hour, 1-hour and 15-minute). Alexander Elder's Triple Screen method, one of the best-known multi-timeframe systems, uses a factor of about five. The exact number matters less than using the same pair every time.
A worked example: one market, two trades
GBP/USD. The prices are an illustration, not real data.
- Daily: an uptrend of higher highs and higher lows, with a demand zone at 1.2680–1.2710 under the last push up.
- 4-hour: falling from a high at 1.2900 in lower highs and lower lows. Inside the daily uptrend, that is a pullback.
| A: sell the pullback now | B: wait, then buy with the daily | |
|---|---|---|
| Agrees with | 4-hour, not daily | Daily, once the 1-hour turns up |
| Entry | Sell 1.2790 on the 1-hour | Buy 1.2725 after a 1-hour break up inside the zone |
| Stop | 1.2815 (25 pips) | 1.2675, below the zone (50 pips) |
| Target | 1.2715, just above the zone (75 pips, 1:3) | TP1 1.2800 (1:1.5), TP2 1.2890 before the 4-hour high (1:3.3) |
| The catch | Its whole target ends where daily buyers are expected | It may never set up; the zone can break |
Trade A looks clean on its own chart and even has a good ratio, but it is selling into the area the bigger trend is most likely to defend, so there is no room beyond its target. Trade B waits for both timeframes to agree and has room to run to the 4-hour high. Neither is guaranteed. Alignment doesn't make B a winner; it makes B the trade that isn't fighting the larger move.
What each combination means
- Higher and entry timeframes agree. Aligned. The usual place to look for entries, ideally after a pullback rather than at the end of a long run.
- Higher trends, entry chart runs against it. Usually a pullback in progress. Wait for the entry chart to turn back, near a higher-timeframe level.
- Higher timeframe is ranging. No bias to follow. Trade the edges or wait for a break.
- Higher timeframe has just printed a CHoCH. The old trend is in doubt. Many traders stand aside until a market structure shift or a new swing confirms the new direction.
What traders disagree on
- How strict to be. Some never trade against the higher timeframe; others take counter-trend trades with shorter targets. Both are rules; mixing them trade by trade isn't.
- How the bias is read. Swing structure (higher highs and higher lows), moving averages (price above a rising average), or both. They usually agree in a clean trend and disagree near turns.
- Whether it adds anything. A minority argue that if you only trade with the higher timeframe, you are joining moves late. There is no published, independent evidence that settles how much alignment improves results, so treat it as a filter that removes some trades, not as proof that the rest will work.
StraviFX reads the bias from structure first and treats alignment as a separate check from confluence: a trade can have several reasons at one price and still be against the higher timeframe.
Why it matters
A setup can be correct on its own chart and still lose because the bigger trend runs straight through it. Checking one timeframe up tells you whether your target has room, whether your stop sits on the side the larger trend is pushing toward, and whether a move against you is a pullback or a reason to drop the idea.
Common mistakes
- Checking the higher timeframe after entering. By then it becomes a search for reasons to stay in. Read it first.
- Shopping for a timeframe that agrees. Flicking between charts until one supports the trade you already want is not alignment. Fix your pair of timeframes in advance.
- Reading a lower timeframe's labels as the higher's. A 15-minute lower low is not a daily one. Label each timeframe's swings separately, as the higher highs / higher lows page shows.
- Treating every pullback as a reversal. In an aligned uptrend, a fall on the entry chart is normal until the higher timeframe's own structure breaks.
Questions
Which higher timeframe should I check?
One that is roughly four to six times your entry timeframe: the 4-hour for 1-hour entries, the 1-hour for 15-minute entries, the daily for 4-hour entries. Much closer and the two charts show nearly the same thing; much further and the higher chart moves too slowly to tell you anything about this trade.
Can I trade against the higher timeframe?
You can, and some traders do it on purpose, but know what you are doing: a counter-trend trade is betting on a pullback inside a bigger move. Keep the target short of the higher timeframe's next level, expect it to fail more often, and decide your rule before the trade, not during it.
What if the higher timeframe is ranging?
Then there is no direction to align with. Treat the range's edges as the levels that matter: buy near the floor, sell near the ceiling, and expect targets in the middle of the range to be harder to reach. Or wait for the range to break and use the new direction.
How many timeframes should I use?
Two or three. A higher one for direction and an entry one for timing covers most styles; a third, faster one is only for fine-tuning the entry. Checking five or six usually means one of them will disagree, which turns into a reason to doubt every trade.
Timeframe alignment in the app
StraviFX's instant market read (Premium) pulls live data for the 1-hour, 4-hour and daily charts together and shows a "HTF alignment" line next to structure, momentum and liquidity; it is told to point out where the timeframes disagree rather than hide it. Swing signals go further: they only look for buys while the daily chart closes above its 50-period average and that average is above the 200-period one (the reverse for sells), find the zone on the 4-hour chart, and time the entry on the 1-hour. If the daily trend flips while a signal is open, the signal is closed and recorded as invalidated by the higher timeframe. When you scan a single chart, the analysis is built from that chart and its own timeframe's price data, so check the timeframe above it yourself.
Get StraviFX
Point your camera at any chart and StraviFX reads the structure, plans the entry, stop and targets, and sizes your risk. Free to download on Android, with optional subscriptions.