Glossary · Indicators
RSI (Relative Strength Index)
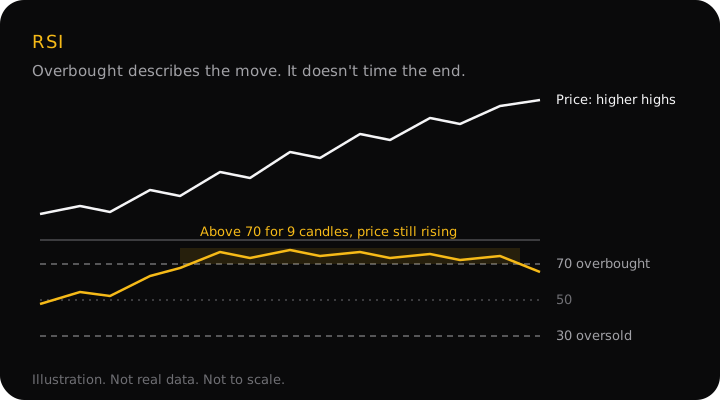
The Relative Strength Index (RSI) is a momentum oscillator from 0 to 100. It compares the average size of recent up closes with recent down closes, usually over 14 candles. Above 70 is conventionally called overbought and below 30 oversold, but in a strong trend RSI can stay there for a long time, so it describes momentum, not a reversal.
How RSI is calculated
J. Welles Wilder Jr. published RSI in his 1978 book New Concepts in Technical Trading Systems. The idea is simple: of the recent movement, how much was up?
- For each of the last 14 candles, take the change from the previous close. An up close counts as a gain, a down close as a loss (written as a positive number).
- Average the gains and average the losses over the 14 candles.
- RS = average gain ÷ average loss
- RSI = 100 − 100 ÷ (1 + RS)
If every close was up, RSI is 100; if every close was down, it is 0. Equal gains and losses give 50. After the first value, Wilder smooths the averages instead of recalculating them from scratch:
new average = (previous average × 13 + this candle's gain or loss) ÷ 14
A worked example, and why platforms disagree
EUR/USD on the 1-hour chart. The closes are an illustration, not real data. Over 14 candles the changes in pips were:
+10, −4, +8, +12, −6, +6, −10, +14, +4, −14, +10, +12, −8, +8
- Gains: 9 up candles totalling 84 pips. Average gain = 84 ÷ 14 = 6.0.
- Losses: 5 down candles totalling 42 pips. Average loss = 42 ÷ 14 = 3.0.
- RS = 6.0 ÷ 3.0 = 2, so RSI = 100 − 100 ÷ 3 = 66.7.
The next candle closes 12 pips lower. Here is the new RSI under the three averaging methods platforms use:
| Method | Avg gain | Avg loss | RSI |
|---|---|---|---|
| Wilder's smoothing: (old × 13 + new) ÷ 14 | 5.57 | 3.64 | 60.5 |
| Simple average of the last 14 (the +10 drops out) | 5.29 | 3.86 | 57.8 |
| Exponential average, weight 2 ÷ 15 | 5.20 | 4.20 | 55.3 |
Same prices, three answers five points apart. Wilder's version is the usual default, but because each value carries a little of every earlier one, it also depends on how much history the platform loaded before your first candle. Add a different price feed and two charts of the same pair rarely agree to the decimal. Read RSI as a zone (above 70, around 50, below 30), not as an exact number.
How traders use it, and where they disagree
- 70 / 30 as overbought and oversold. Wilder's levels. Some traders use 80 / 20 so the extremes mean more, especially in trending markets.
- The 50 line as a trend filter. RSI holding above 50 means up closes have outweighed down closes; some traders only look for buys while it does, and for sells below it.
- Divergence. Price makes a new high or low and RSI doesn't. That is a separate idea with its own page: divergence.
StraviFX's convention: RSI is evidence about momentum, read alongside market structure. It never decides a trade on its own, and an overbought reading in an uptrend is not a reason to sell.
Why it matters
RSI turns a row of candles into one number that says how one-sided the recent move has been. That helps you notice when a trend is running hot or losing pace. It doesn't say where price will turn, and the strongest trends are the ones where "overbought" lasts longest.
Common mistakes
- Selling every reading above 70. In an uptrend that means selling into strength again and again. Wait for a break in structure before treating a top as likely.
- Buying every reading below 30. The same mistake in a downtrend, with a falling market under it.
- Comparing RSI values across platforms. A 69 on one chart and a 72 on another can be the same market.
- Counting RSI as an extra reason. It is built from the same closes as the chart, so RSI agreeing with a trend you can already see is not independent confluence.
Questions
Does RSI above 70 mean I should sell?
No. It means recent up closes have been much larger than down closes, which is exactly what a strong uptrend looks like. RSI can stay above 70 for many candles while price keeps rising. Treat it as a reading of momentum, and look for a break in structure before calling a top.
Why is my RSI different from someone else's on the same chart?
Platforms can average gains and losses differently (Wilder's smoothing, a simple average or an exponential one), use a different number of candles, start the calculation at a different point in the history, or read a different price feed. On the same data those choices can move the reading by several points.
What is the best RSI setting?
There is no best one. Wilder's 14 is the default almost everywhere, which is useful because it is what other traders see. A shorter period reacts faster and reaches 70 and 30 more often; a longer one is smoother and reaches them less. Change it only if you test the change in your own journal.
Is RSI the same as relative strength between two stocks?
No. RSI compares a market only with its own recent closes. Comparative relative strength, sometimes also called relative strength, divides one market's price by another's, such as a stock against its index. The names are similar, the ideas are not.
RSI in the app
The instant market read in StraviFX (Premium) shows an RSI reading in its market snapshot, next to the 20, 50 and 200-period EMAs and the ATR. The app calculates them from the candles it fetches for that market rather than from your screen, so the figure can differ by a few points from your platform's RSI(14) for the reasons above. It is shown as context for the structure read, not as a signal.
Get StraviFX
Point your camera at any chart and StraviFX reads the structure, plans the entry, stop and targets, and sizes your risk. Free to download on Android, with optional subscriptions.