Glossary · Zones
Optimal trade entry (OTE)
Optimal trade entry (OTE) is the band between the 62% and 79% retracement of the last impulse leg, where traders look to enter on a pullback in the trend's direction. It is a deep pullback, so the stop beyond the leg's start sits close and a target at the old high pays more than the risk.
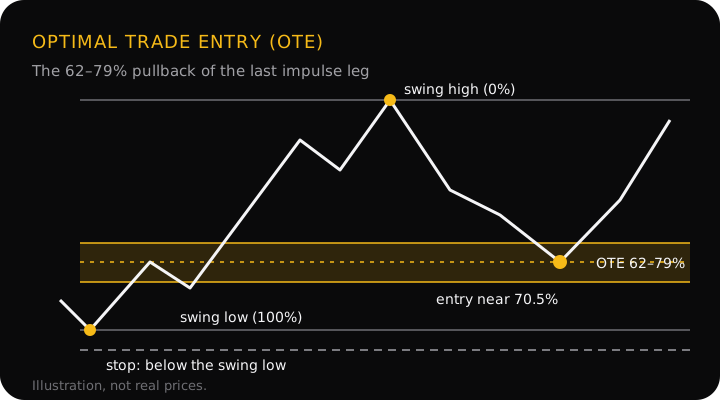
How to mark the OTE zone
- Pick the leg. Use the last impulse move that did something: broke structure or swept liquidity. Mark its ends from the wicks, as you would any swing point.
- Measure the pullback. For a bullish leg, each level is high − (high − low) × ratio. For a bearish leg, it is low + (high − low) × ratio. Use 0.62 and 0.79 for the edges, and 0.705 for the middle line many traders aim at.
- Wait for price to come to you. A pullback into the band is where you look for a reason to enter, such as an order block or a fair value gap inside it.
A Fibonacci retracement tool drawn from the swing low to the swing high does the math for you; add the 0.705 and 0.79 levels if your platform doesn't show them.
What traders disagree on
- The exact numbers. 62% and 79% (ICT-style rounding) or 61.8% and 78.6% (standard Fibonacci). The gap is a fraction of a pip on most legs.
- Whether a structure shift must come first. In the stricter version, OTE only counts after a sweep and a market structure shift; the leg that made the shift is the one you measure. Others apply it to any pullback in a trend.
- Where in the band to enter. At the 62% edge (more fills), at 70.5% (the usual compromise) or with a limit order spread across the band.
StraviFX's glossary uses the 62–79% band. None of these levels has published evidence that it beats any other pullback depth; treat OTE as a way to define "deep enough" before you trade, not as a level price respects.
A worked example
A 1-hour EUR/USD chart. The prices are an illustration, not real data.
- The leg: price rallies from a swing low at 1.0800 to a high at 1.0900 (100 pips) and breaks structure.
- The band: 62% is 1.0900 − 0.0100 × 0.62 = 1.0838; 79% is 1.0821; the 70.5% line is about 1.0830.
- The plan: buy at 1.0830, stop at 1.0790 (10 pips below the swing low), target the old high at 1.0900. That is 40 pips of risk for 70 pips of reward, 1:1.75.
- The same trade from the halfway point, 1.0850: 60 pips of risk for 50 pips of reward, 1:0.83.
- Sized at 1% of a $1,000 account ($10): the OTE entry allows 0.02 lots (rounded down from 0.025), risking $8 to make $14. The 1.0850 entry allows only 0.01 lots, risking $6 to make $5.
The deeper entry is the better trade on paper, and it is also the one that fills less often. The risk-reward calculator and the lot size calculator run these numbers for any levels.
Why it matters
OTE is a stricter version of buying in discount: instead of anywhere below halfway, it asks for a pullback deep enough that the stop is close and the target is far. It gives you a rule for "not here, not yet" that you set before price arrives, which is the easiest way to stop chasing moves.
Common mistakes
- Measuring the wrong leg. Draw from the swing that started the move to the swing that ended it. A leg drawn from the middle of a move puts the band in the wrong place.
- Buying OTE against the trend. In a downtrend, a pullback into the lower part of a small rally is a sell zone, not a buy. The trend picks the direction; OTE only picks the price.
- Keeping the trade when price closes below the leg's start. If price falls through 100%, the leg has failed. The stop belongs beyond that level, not somewhere inside the band.
- Treating 70.5% as exact. It is a reference line in a zone. Price turning at 66% or 75% is the same idea.
Questions
Is OTE 62% or 61.8%, and 79% or 78.6%?
Both versions are in use. ICT-style teaching rounds to 62% and 79%; standard Fibonacci tools plot 61.8% and 78.6%. On a 100-pip leg the difference is well under a pip at each edge, so it rarely matters. Pick one and use it every time.
What is the difference between OTE and the golden pocket?
The golden pocket is usually the narrow 61.8–65% band. OTE starts at the same place but reaches deeper, to 79%. A trader who waits for OTE accepts fewer fills in exchange for a closer stop and a larger reward for the same target.
Does OTE work on every timeframe?
The math works on any leg. Whether the level means anything depends on the leg you measure: a leg that broke structure or swept liquidity gives a band worth watching; a small wiggle on a 5-minute chart gives a band that price passes through without noticing.
What if price never pulls back into OTE?
Then there is no OTE trade. Strong trends often pull back only 38–50% before moving on. Chasing the move from higher up means a wider stop or a worse ratio, so many traders let it go and wait for the next leg.
OTE in the app
The StraviFX glossary defines OTE so you can follow any reading that mentions it, and every term in an analysis links to its definition. On Premium's extended analysis the same logic sits in the plan: each target must be at least 1.5 times the risk, and when price at market is too far from the level that would prove the idea wrong, the plan uses a pullback entry closer to that level instead of shrinking the stop. The decision stays with you.
Get StraviFX
Point your camera at any chart and StraviFX reads the structure, plans the entry, stop and targets, and sizes your risk. Free to download on Android, with optional subscriptions.