Glossary · Liquidity
Equal highs / equal lows
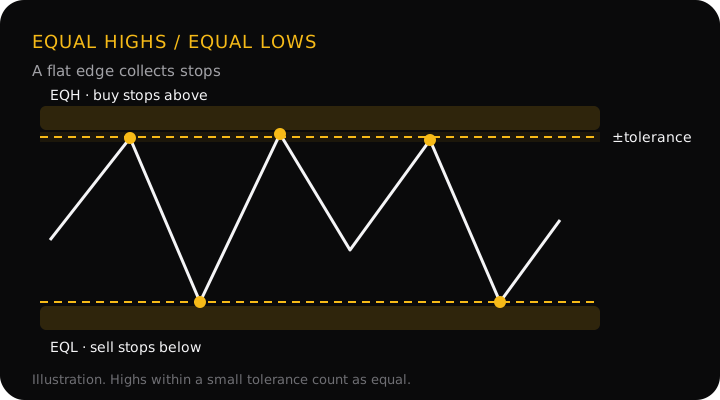
Equal highs (EQH) are two or more highs at nearly the same price; equal lows (EQL) are the same below price. They leave a flat edge on the chart that many traders read as a ceiling or floor, so stop orders gather just beyond it. That makes them a common target for a sweep rather than a reliable barrier.
How equal is equal
Highs almost never match to the pip, so every trader uses some tolerance, and the rules vary: a fixed number of pips, a fraction of the average candle range, or simply what looks flat. The StraviFX glossary says “nearly the same price” and doesn't set a number.
A rule of thumb that scales with the market is a gap no bigger than about a tenth of the average candle range (ATR) on the timeframe you are reading. If 1-hour GBP/USD candles average 30 pips, highs within 3 pips count as equal. On a daily chart, where candles are several times larger, the tolerance grows with them. Too loose a tolerance makes every pair of highs look equal; too tight, and you miss the edges everyone else sees.
Equal highs vs a double top
A double top and equal highs can be the same two peaks. The difference is the reading:
- Double top (classic chart pattern): the second peak failing at the first is read as a reversal, confirmed when price closes below the low between them.
- Equal highs (liquidity reading): the flat edge shows where buy-side liquidity has stacked up, so price is often expected to push through it, at least briefly, before anything else.
Neither reading is a forecast. A close beyond the edge, or back inside it, settles which one the chart is showing.
A worked example
On a 1-hour GBP/USD chart, three highs print at 1.2702, 1.2704 and 1.2701, and two lows at 1.2640. The average candle range is 30 pips. The prices are an illustration, not real data.
- Are they equal? The highs span 3 pips, within the 3-pip tolerance (a tenth of 30), so they count as equal highs. The lows match exactly: equal lows.
- What can happen next: a candle wicks to 1.2716 and closes at 1.2694, back below all three highs. That is a liquidity sweep. A close at 1.2715 instead would be a break, and a retest of the old highs from above could follow.
- The trade idea after the sweep: a sell at 1.2694 with the stop at 1.2721, 5 pips above the sweep wick (27 pips of risk). The target is 1.2643, just before the equal lows and their stops (51 pips): a 1:1.89 risk-to-reward.
- The size: risking $27 at $10 a pip per standard lot over 27 pips gives 0.10 lots.
The lot size calculator works out the size for any stop distance.
Why it matters
Equal highs and lows are among the easiest levels to see, which is exactly why so many stops sit behind them. Beginners often sell just under equal highs with a stop a pip above them, the very price a sweep reaches first. Seeing the flat edge as a pool of stops, not a wall, changes where you put both your entry and your stop.
Common mistakes
- Treating them as strong resistance or support. More touches mean more stops behind the edge, which makes a push through it more likely.
- Using a tolerance that is too loose. If highs 20 pips apart on a 1-hour chart count as equal, almost everything does, and the label stops meaning anything.
- Mixing timeframes. Two highs that look equal on a daily chart can be 30 pips apart on a 15-minute one. Judge them on the timeframe you trade.
- Placing the stop one pip past the edge. That is the first price a sweep takes. Put it beyond the area with room to spare and reduce the lot size.
Questions
How close do two highs have to be to count as equal?
There is no official number. The StraviFX glossary says nearly the same price and sets no tolerance. A workable rule of thumb is a gap no bigger than about a tenth of the average candle range on that timeframe, so the tolerance grows with volatility and timeframe instead of being a fixed number of pips.
Are equal highs the same as a double top?
Same shape, different reading. A double top is a classic reversal pattern, confirmed when price closes below the low between the two peaks. Equal highs are a liquidity reading: the flat edge collects stops, so price is often expected to push through it first. Both readings can be wrong; the closes decide.
Do equal highs act as resistance?
Sometimes, but treat them as a target rather than a wall. Each touch adds more stops behind the level, which makes a sweep through it more likely, not less.
What happens after equal highs are swept?
The stops behind them are filled, so the level loses most of its pull. If the sweeping candle closes back below, that is a sweep and can start a move the other way. If price closes above and holds, the highs are simply broken.
Equal highs in the app
When a StraviFX analysis mentions equal highs or lows (EQH, EQL), the term links to the in-app glossary, which uses the same definition as this page. One detail if you compare charts: the Swing signals check marks a swing high only when it is strictly above the three candles on each side, so two neighbouring candles with exactly the same high don't count as a swing at all. Equal highs further apart are each their own swing, and a sweep of the latest one is read the same way as any other.
Get StraviFX
Point your camera at any chart and StraviFX reads the structure, plans the entry, stop and targets, and sizes your risk. Free to download on Android, with optional subscriptions.