Glossary · Structure
Higher highs and higher lows
Higher highs and higher lows define an uptrend: each peak rises above the last, and each pullback holds above the previous low. Lower highs and lower lows, the mirror image, define a downtrend. Labelling each swing this way turns "the trend looks up" into a rule anyone can check on the chart.
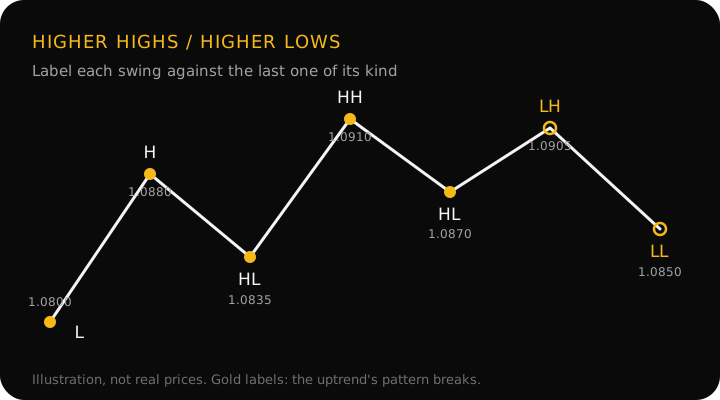
The four labels
First mark the swing highs and swing lows. Then compare each swing with the previous swing of the same kind: highs with highs, lows with lows.
- HH, higher high: a swing high above the previous swing high.
- HL, higher low: a swing low above the previous swing low.
- LH, lower high: a swing high below the previous swing high.
- LL, lower low: a swing low below the previous swing low.
What each combination means
| Highs | Lows | Structure |
|---|---|---|
| Higher (HH) | Higher (HL) | Uptrend |
| Lower (LH) | Lower (LL) | Downtrend |
| Lower (LH) | Higher (HL) | Range, narrowing |
| Higher (HH) | Lower (LL) | Range, widening |
Only the first two rows are trends. When the highs and lows disagree, neither buyers nor sellers are in control, and the StraviFX glossary reads it as a range. For how these states fit together on a chart, see market structure.
A worked example
EUR/USD on the 4-hour chart prints these swings, in order. The prices are an illustration, not real data.
- Low 1.0800: the starting point.
- High 1.0880: the first high, nothing to compare it with yet.
- Low 1.0835: above 1.0800, so a higher low.
- High 1.0910: above 1.0880, so a higher high. The structure is now bullish.
- Low 1.0870: above 1.0835, another higher low.
- High 1.0905: below 1.0910, a lower high. The first warning.
- Low 1.0850: below 1.0870, a lower low.
The candle that closed below 1.0870 on the way to 1.0850 was a change of character, the first break of the uptrend. The latest labels now read lower high and lower low, but by the StraviFX convention the new downtrend is confirmed only if the next rally also fails and a candle closes below 1.0850: a market structure shift.
Why it matters
The labels tell you which side of the market has been winning, and which level matters next. In an uptrend, the latest higher low is the line the trend has to defend, which makes it a logical place for a buyer's stop loss. The latest swing high is the line that has to break for the trend to continue, which is what a break of structure is.
Common mistakes
- Comparing a high with a low. A higher high is higher than the previous high, not higher than the last candle.
- Skipping a swing. Compare each swing with the one right before it. Measuring from an older swing makes a trend look healthier than it is.
- Calling a downtrend on one lower high. It takes a close below the last higher low to break the uptrend.
- Reading one timeframe's labels into another. Lower highs on the 15-minute chart can be a normal pullback inside higher highs on the daily chart.
Questions
How many higher highs make an uptrend?
There is no fixed number. You need at least two highs and two lows to compare, so one higher high and one higher low is the minimum to call the structure bullish. Each extra pair adds evidence, and a long run of them also means the trend is older.
Is a lower high the start of a downtrend?
Not on its own. A lower high in an uptrend is a warning that buyers couldn't make a new extreme, but the trend is only broken when price closes below the last higher low. Until then, the lower high can still turn out to be a pause.
What does HH, HL, LH and LL mean on a chart?
They are labels for swing points: HH is a higher high, HL a higher low, LH a lower high and LL a lower low. Each swing high is labelled against the previous swing high, and each swing low against the previous swing low.
What if a new high equals the last one?
Then it is neither higher nor lower, and the uptrend has stalled. Equal highs often turn a trend into a range, and many traders watch them closely because stop orders tend to cluster just above them.
Trend labels in the app
When StraviFX reads a chart, it states the trend in plain English and explains the swing structure behind it, with a 1-hour, 4-hour and daily brief in one view so you can see where timeframes disagree. The read is analysis, not a signal to trade; the decision stays with you.
Get StraviFX
Point your camera at any chart and StraviFX reads the structure, plans the entry, stop and targets, and sizes your risk. Free to download on Android, with optional subscriptions.