Glossary · Zones
Supply and demand zones
A supply or demand zone is an area where price previously turned sharply, suggesting unfilled selling (supply) or buying (demand) interest may still be resting there. A demand zone sits below price and is watched for buys; a supply zone sits above it and is watched for sells. The first return to a zone usually counts most.
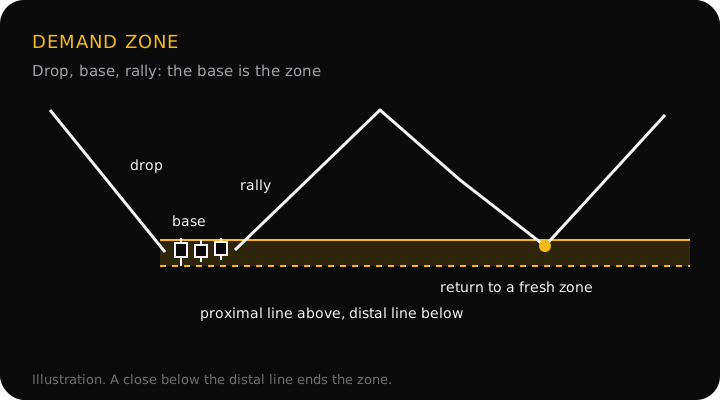
How to draw a zone
- Find the sharp move. Look for several large candles leaving an area quickly, ideally breaking a recent high or low on the way. A slow drift away doesn't count.
- Find the base. The base is the one to three small candles just before the move, where price paused. If there is no pause, use the candle the move turned on.
- Draw two lines. The proximal line is the edge of the base nearest current price; the distal line is the far edge, taken from the extreme wick. For demand, the proximal line is the top of the base and the distal line its lowest low.
The move before the base tells you the pattern. Drop, base, rally or rally, base, rally make a demand zone. Rally, base, drop or drop, base, drop make a supply zone. The first two of each pair are reversals; the second are continuations of a trend that paused.
What traders disagree on
- The proximal line. Some draw it at the top of the base's candle bodies, others at the top of the wicks. Bodies give a narrower zone and a tighter stop; wicks get filled more often.
- Fresh or tested. Many trade only fresh zones, ones price hasn't returned to. Others accept a second or third touch.
- How strong the move must be. Some want the move to break structure; others accept any fast move away.
- Zone or order block. Smart-money traders often narrow a demand zone to its order block, the last down candle in the base. Same idea, smaller box.
StraviFX's glossary uses the plain definition above. This page draws the distal line from the wick and counts a zone as broken only when a candle closes beyond it, the same close rule the rest of the glossary uses. Pick your own version of the rest and keep it fixed, so your journal can show whether it works.
A worked example
A 1-hour gold (XAU/USD) chart. The prices are an illustration, not real data.
- The zone: gold drops, pauses for three small candles, then rallies hard to 4,048, breaking the last lower high. The base's candle bodies top out at 4,020 (proximal line) and its lowest wick is 4,013 (distal line). The zone is fresh.
- The trade idea: a buy limit at 4,020, with the stop at 4,010, $3 below the distal line. That is a $10 stop. The target is the high at 4,048, $28 away: a 1:2.8 risk-to-reward.
- The size: one standard lot of gold is 100 ounces, so a $10 move is $1,000 per lot. On a $2,000 account risking 1% ($20), that is 0.02 lots, risking $20.
Buy at the middle of the zone instead, 4,016.50, and the stop shrinks to $6.50 and the ratio grows to about 1:4.8, but price may never trade that deep and you miss the trade. A close below 4,013 ends the zone either way. The lot size calculator handles gold and works out the size for any stop.
Why it matters
A zone turns "price might bounce around here" into two numbers: where to enter and where you're wrong. That is what a stop loss and a lot size need. It also keeps you from buying in the middle of nowhere: if price isn't at a zone, there is often no trade yet.
Common mistakes
- Zones everywhere. Marking every pause gives you a zone at every price, which means none of them tells you anything. Keep the ones with a sharp move away.
- Boxes that are too wide. A wide zone means a wide stop and a small position. If the base is huge, look for a tighter one on a lower timeframe or skip it.
- Trading against the bigger trend. Demand zones in a downtrend fail more often than the chart makes them look. Check market structure on the higher timeframe first.
- Using a broken zone. Once a candle closes beyond the distal line, the zone is gone. It may now work the other way, as a retest from the other side.
- The stop on the line. Price often wicks to the distal line exactly. Leave a little room beyond it.
Questions
What is the difference between a supply and demand zone and support and resistance?
Support and resistance is usually a line at a price that has held several times. A supply or demand zone is an area, drawn around the base a sharp move started from, and it is often strongest before price has come back to it at all. The ideas overlap; the zone gives you a top and bottom to put the entry and the stop.
Is a demand zone the same as an order block?
They overlap. Both mark an area a strong move left from. An order block is narrower: the last opposing candle before the move. A supply or demand zone is usually drawn around the whole base, which can be several candles, so it is wider.
How many times can a supply or demand zone be used?
There is no fixed number. Many traders treat the first return as the best one and each later touch as weaker, on the idea that the resting orders get used up. A close beyond the far edge of the zone ends it.
Which timeframe should I draw zones on?
Draw them on the timeframe you plan the trade on, and check the zone sits in the direction of the higher timeframe. A 15-minute demand zone inside a daily downtrend is a weaker buy than the same zone inside a daily uptrend.
Supply and demand in the app
The StraviFX glossary defines supply and demand zones so you can follow any reading that mentions one, and every term in an analysis links to its definition. An analysis gives an entry zone, a stop and two targets from the chart's structure; on Premium's extended analysis the stop goes just beyond the swing point or order block that would prove the idea wrong, and each target must offer at least 1.5 and 2 times the risk. The decision stays with you.
Get StraviFX
Point your camera at any chart and StraviFX reads the structure, plans the entry, stop and targets, and sizes your risk. Free to download on Android, with optional subscriptions.