Glossary · Structure
Break of Structure (BOS)
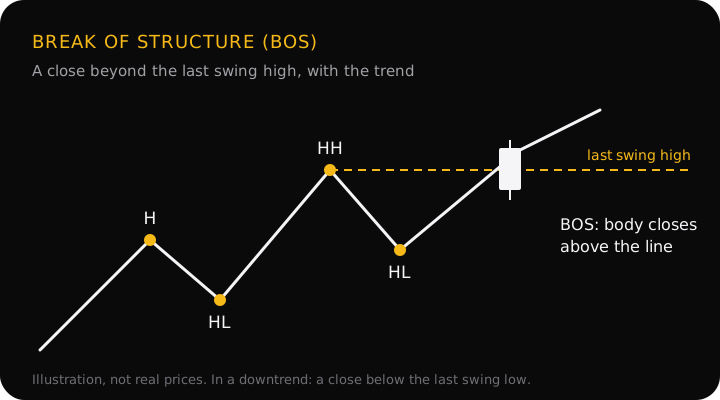
A break of structure (BOS) is when a candle closes beyond the most recent swing high in an uptrend, or below the most recent swing low in a downtrend. It confirms the existing trend is continuing. A BOS is a continuation signal, not a reversal, and traders use it as evidence the trend is still intact.
Close or wick? The conventions differ
There is no official definition of a break of structure, and the pages that rank for it disagree. You will meet three versions:
- Candle close. A candle on the timeframe you are reading has to close beyond the swing point.
- Any wick. Price trading beyond the swing point for a moment is enough.
- Close with a strong candle. Some traders also want a large, fast candle (often called displacement) so the break isn't a slow drift through the level.
StraviFX uses the close. A wick beyond the level that closes back inside is read as a possible liquidity sweep instead: the stops resting above the high were triggered, but price didn't stay there. Whichever rule you pick, use the same one every time, or your structure labels will change with your mood.
A worked example
EUR/USD on the 1-hour chart is in an uptrend. The last swing high is 1.0850 and the pullback after it bottomed at 1.0815, a higher low. These prices are an illustration, not a trade idea.
- BOS: a candle closes at 1.0862, above 1.0850. The uptrend has made a new high, and 1.0815 is now the higher low that has to hold.
- Not a BOS: a candle spikes to 1.0858 but closes at 1.0846, back below 1.0850. Under the close rule nothing has broken; the spike may have been a sweep of the stops above the high.
If price later closed below 1.0815 instead, that would not be a BOS. It would be a change of character, the first break against the uptrend.
BOS vs CHoCH
| BOS | CHoCH | |
|---|---|---|
| Direction | With the trend | Against the trend |
| Level broken (uptrend) | Last swing high | Last higher low |
| Level broken (downtrend) | Last swing low | Last lower high |
| What it says | The trend is continuing | The trend may be ending |
Why it matters
A BOS tells you the current direction still has buyers (or sellers) behind it, so plans that trade with the trend stay on. It also moves the line in the sand: after a bullish BOS, the higher low that came before it is the level that would prove the uptrend wrong, which makes it a logical place to think about a stop loss.
Common mistakes
- Counting wicks on some days and closes on others. Pick one rule and keep it.
- Reading a lower timeframe BOS as a higher timeframe one. A 5-minute BOS inside a 4-hour downtrend is a pullback getting stronger, not a new uptrend.
- Chasing the breakout candle. Buying the close of a big candle puts the stop a long way off, so the same risk buys a much smaller position. Check the distance with the risk reward calculator first.
- Treating a BOS as a forecast. It describes what price has done. Trends that just broke structure can still reverse on the next candle.
Questions
Is a break of structure bullish or bearish?
It takes the direction of the trend it belongs to. In an uptrend, a close above the last swing high is a bullish BOS; in a downtrend, a close below the last swing low is a bearish BOS. A break against the trend has a different name: a change of character.
Does a wick through the swing high count as a BOS?
Traders disagree. Some count any trade beyond the level; others, including StraviFX, need a candle to close beyond it. A wick that pokes through and closes back inside is treated as a possible liquidity sweep: stops above the high were triggered, but buyers couldn't hold price there.
What is the difference between a BOS and a breakout?
A breakout usually means price leaving a range or crossing any level a trader has drawn. A BOS is narrower: it is a close beyond the latest swing point of an existing trend, so it only exists once a trend of higher highs and higher lows (or lower highs and lower lows) is already in place.
Should I enter as soon as I see a BOS?
A BOS says the trend is intact; it isn't an entry on its own. Entering on the breakout candle often puts the stop far away. Many traders wait for a pullback and plan the stop beyond the new higher low, then size the trade with a lot size calculator. None of this guarantees the trade works.
Break of structure in the app
When StraviFX reads a chart, it names the trend and the swing points behind it, and the BOS or CHoCH where it sees one, in plain English. Tap the term to see its definition. The plan that follows (entry, stop, two targets and the lot size) is analysis, not a signal to trade; the decision stays with you.
Get StraviFX
Point your camera at any chart and StraviFX reads the structure, plans the entry, stop and targets, and sizes your risk. Free to download on Android, with optional subscriptions.