Glossary · Structure
Market structure
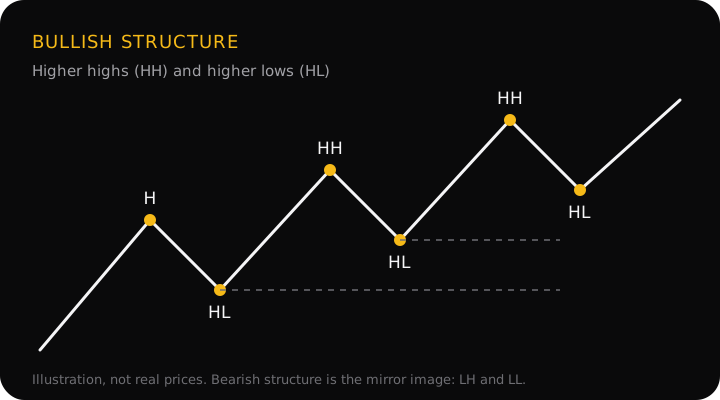
Market structure is the pattern of swing highs and swing lows a market prints. Higher highs and higher lows make bullish structure, lower highs and lower lows make bearish structure, and anything else is a range. Traders read it first because it sets which direction they should be trading in.
How to read market structure
- Mark the swing points. A swing high is a candle whose high is above the candles on either side of it; a swing low is a candle whose low is below both neighbours. That is the simplest definition, and the one the StraviFX glossary uses. Many traders and indicators ask for two or more candles on each side, which marks fewer, more important swings.
- Compare each swing with the one before. Label each high as a higher high (HH) or a lower high (LH), and each low as a higher low (HL) or a lower low (LL).
- Name the structure. HH and HL together are bullish. LH and LL together are bearish. Mixed labels, such as lower highs with higher lows, or highs and lows stalling at the same prices, are a range.
The three states
Bullish structure
Higher highs and higher lows. Buyers push past the last peak, and sellers can't drive price back to the previous low. The latest higher low is the level that has to hold for the uptrend to stay intact.
Bearish structure
Lower highs and lower lows. Each rally fails below the last one, and each drop goes further. The latest lower high is the level that has to hold for the downtrend to stay intact.
Range
Price moves between a ceiling and a floor without making progress. Trend strategies do badly here, and a range often comes before a bigger move, so it can be a reason to wait rather than to trade.
How structure changes
Structure changes when a candle closes beyond a swing point. Two breaks matter, and they mean opposite things:
- A break of structure (BOS) closes beyond the last swing in the direction of the trend. It says the trend is continuing.
- A change of character (CHoCH) closes beyond the last swing against the trend, such as an uptrend closing below its last higher low. It is the first warning that the trend may be ending.
Structure depends on the timeframe
The same market can be bullish on the daily chart and bearish on the 15-minute chart at the same moment, because a pullback inside a daily uptrend is a small downtrend of its own. Neither reading is wrong; they answer different questions.
A common way to handle it is to let the higher timeframe set the direction and use the lower one only to time the entry. The StraviFX app shows a 1-hour, 4-hour and daily brief in one view for this reason.
Why it matters
Market structure sets the direction you are allowed to trade in. Buying into bearish structure means fighting the trend, and it is the most common reason a well-placed entry still fails. It also gives the stop loss a logical home: beyond the swing point that would prove the structure wrong, rather than a random number of pips. Once the stop is set, the lot size calculator turns that distance into a position size.
Common mistakes
- Marking every wiggle as a swing. On a fast chart this turns every few candles into a "trend change". Use a stricter swing definition or a higher timeframe.
- Mixing timeframes. A 5-minute downtrend is not a reason to sell against a 4-hour uptrend. Decide which timeframe sets your direction before you look.
- Switching between wicks and closes. Decide whether a break needs a candle close or only a wick, and use the same rule every time. StraviFX uses the close.
- Calling a reversal on one break. A single close against the trend is a warning, not a new trend. A new trend needs new highs and lows in the other direction.
Questions
Is market structure the same as the trend?
Almost. The trend is the direction; market structure is the evidence for it. Saying "the trend is up" is an opinion, while "the last two highs and the last two lows are each higher than the ones before" is something anyone can check on the chart.
Which timeframe should I read market structure on?
Start with the higher timeframe you trade from, such as the 4-hour or daily chart, to decide direction, then drop to a lower timeframe to plan the entry. A lower timeframe can show the opposite structure during a pullback, and that is normal.
Does market structure work for gold, crypto and stocks?
The idea applies to any market that prints a price chart, because it only uses swing highs and lows. Fast markets such as gold and crypto print more small swings, so traders often use a stricter swing definition, or a higher timeframe, to filter the noise.
What breaks market structure?
A candle closing beyond a swing point. A close beyond the last swing high in an uptrend is a break of structure (continuation); a close below the last higher low is a change of character (the first warning of a reversal).
Market structure in the app
When you scan a chart, StraviFX describes its structure in plain English before anything else: the trend, the swing points that define it, and any break of structure or change of character. Every term in the analysis links to its definition. The read is analysis, not a signal to trade; the decision stays with you.
Get StraviFX
Point your camera at any chart and StraviFX reads the structure, plans the entry, stop and targets, and sizes your risk. Free to download on Android, with optional subscriptions.