Glossary · Liquidity
Buy-side / sell-side liquidity
Buy-side liquidity (BSL) is the pool of buy orders resting above price, mostly the stop losses of short sellers and breakout buy stops. Sell-side liquidity (SSL) is the mirror below price: buyers' stop losses and breakout sell stops. The names tell you which way a move may travel next.
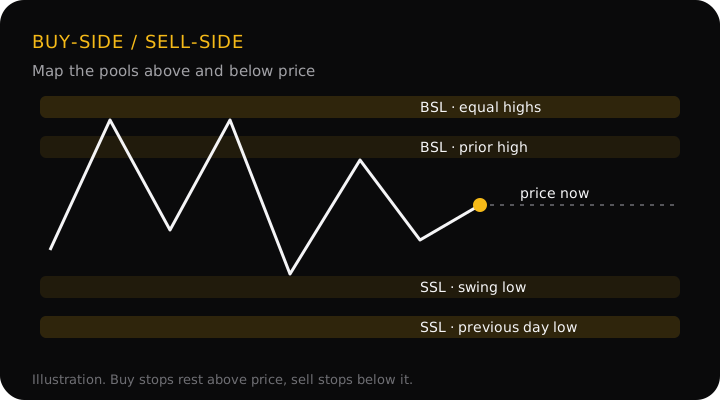
Why the names point that way
The names describe the orders, not the traders. A trader who is short exits by buying, so their stop loss is a buy order sitting above price. A breakout trader waiting to buy above a high uses a buy-stop entry in the same place. Together they make buy-side liquidity. Below price, buyers' stop losses and breakout sellers' entries are all sell orders: sell-side liquidity.
The general idea, and the second meaning of the word that market liquidity is not, is on the liquidity page. This page is about naming the two pools and using them.
How to mark BSL and SSL on a chart
Start from the current price and mark the obvious levels each way:
- Old swing highs and lows that price hasn't traded back through since. Use confirmed swing points, not every bump.
- Equal highs and equal lows, where stops from several entries stack behind one flat edge.
- The previous day's and week's high and low, which most traders can see on any chart.
- The edges of a range, and round numbers near them.
Levels price has already traded through are spent: the stops there have been filled. Mark them differently, or remove them, so the map shows only pools that are still there.
A worked example
A 1-hour gold (XAU/USD) chart with price at 4,020.00. The prices are an illustration, not real data.
- The map: buy-side liquidity at 4,045.00 (yesterday's high) and 4,062.00 (two equal highs from earlier in the week). Sell-side liquidity at 4,003.00 (the last swing low) and 3,990.00 (the previous day's low).
- The trade idea: the trend is up, so the draw is buy-side. A buy at 4,020.00 with the stop at 3,996.00, below the swing low and its stops, risks $24.00 an ounce.
- Which pool to target: the first BSL pool, 4,045.00, is $25.00 away: a 1:1.04 risk-to-reward. The equal highs at 4,062.00 are $42.00 away: 1:1.75. The map shows the nearer target barely pays for the risk.
- The size: one standard lot is 100 ounces, so a $24.00 stop costs $2,400 per lot. Risking $50 gives 0.02 lots (risk $48); at 4,062.00 the gain would be $84.
The risk reward calculator and lot size calculator do this arithmetic for gold and forex pairs.
Why it matters
A map of buy-side and sell-side liquidity answers two questions before a trade: where is price likely to travel (the nearest untouched pool in the trend's direction), and where are the stops that a sweep would take (including, possibly, yours). It turns a target from a guess into a level you can point at.
Common mistakes
- Mixing up the sides. Buy-side is above price, sell-side below, whoever placed the orders. Read the order, not the trader.
- Setting the target just past the pool. Price often reaches a pool, fills the orders and turns. A target a little before the level is more likely to be filled than one beyond it.
- Keeping spent levels on the map. A high that has already been swept has less pull. Look for the next untouched one.
- Putting your stop inside the opposite pool. A buyer's stop just under the obvious low is part of the sell-side liquidity a sweep would take. Give it room and size down.
Questions
Why is buy-side liquidity above price if it comes from sellers?
Because a seller's stop loss is a buy order. Someone who is short closes the trade by buying, and their stop sits above the market. So the orders resting above price are buys, whoever placed them. The same logic puts buyers' stop losses, which are sell orders, below price.
What does draw on liquidity mean?
It is the pool you expect price to reach next. In an uptrend the nearest untouched buy-side liquidity above price is the usual draw; in a downtrend it is the sell-side liquidity below. It is a way of choosing a target, not a forecast that price will get there.
What are internal and external liquidity?
Terms from ICT-style trading. External range liquidity is the highs and lows at the edges of the current swing or range. Internal range liquidity is inside it, often gaps left by fast moves. This page and the StraviFX app work with the outer highs and lows.
Is liquidity still there after price has taken it?
Mostly not. Once price trades through a pool the stops there have been filled, so that level has less pull. The next untouched high or low becomes the more likely draw.
Liquidity targets in the app
StraviFX's hourly Swing signals check (Premium, monthly plans and longer) takes the highest high and the lowest low of the last 80 four-hour candles as the buy-side and sell-side targets. For a buy idea it aims at that high if it is above price; if there isn't one, it sets the target at twice the risk instead. Sell ideas use the low the same way. These are rules for reading a chart, not predictions; the decision stays with you.
Get StraviFX
Point your camera at any chart and StraviFX reads the structure, plans the entry, stop and targets, and sizes your risk. Free to download on Android, with optional subscriptions.