Glossary · Indicators
Candlestick / OHLC
A candlestick summarises one period of trading with four prices: the open, high, low and close (OHLC). The body spans the open to the close and is coloured by direction; the wicks reach the high and the low. A candle shows where price went, but not in what order, which matters when one candle touches both your stop and target.
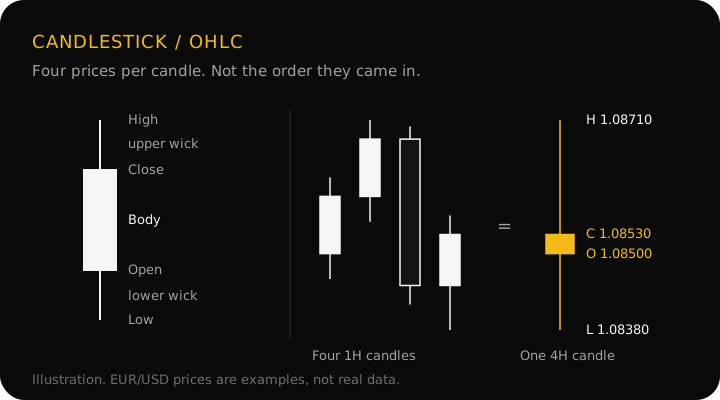
Reading one candle
- Open: the first traded price of the period.
- Close: the last price of the period. Most definitions of a break, including break of structure, care about where a candle closed, not where it reached.
- High and low: the extremes. The wicks (or shadows) run from the body to these.
- Body: open to close. A close above the open is an up candle, below it a down candle.
A big body with small wicks means price moved one way and stayed there. Small bodies with long wicks mean price travelled but was pushed back before the close. Most forex charts are drawn from the bid price, so a candle shows where sellers could have sold; see spread for why that matters to a sell's stop.
A worked example: four hours, one candle
Four 1-hour EUR/USD candles. The prices are an illustration, not real data.
| Candle | Open | High | Low | Close |
|---|---|---|---|---|
| 1H #1 | 1.08500 | 1.08620 | 1.08460 | 1.08590 |
| 1H #2 | 1.08590 | 1.08710 | 1.08550 | 1.08680 |
| 1H #3 | 1.08680 | 1.08700 | 1.08420 | 1.08450 |
| 1H #4 | 1.08450 | 1.08560 | 1.08380 | 1.08530 |
| 4H | 1.08500 | 1.08710 | 1.08380 | 1.08530 |
The 4-hour candle takes the open of the first hour, the highest high, the lowest low and the close of the last hour. Its body is 3 pips (1.08500 to 1.08530), its upper wick 18 pips and its lower wick 12 pips. On the 4-hour chart this looks like indecision; on the 1-hour chart it was a 21-pip rally followed by a 33-pip drop.
Now put a trade on it: a buy at 1.08500 with a stop at 1.08400 and a target at 1.08700. The 4-hour candle reached both (high 1.08710, low 1.08380), and from that candle alone you can't tell which came first. The 1-hour candles can: the target was hit in hour 2, before the stop would have been hit in hour 4.
Things that change what a candle shows
- When the day starts. Daily candles in forex depend on the platform's day boundary. Many brokers close the day at 5 p.m. New York time; a chart set to midnight in another time zone shows different daily candles, and can show a short Sunday one.
- Bid or ask. Charts usually draw the bid. The ask candle is the same shape, one spread higher.
- The data feed. Forex has no single exchange, so two brokers' candles can differ by a pip or two at the extremes. A wick on one chart may not reach a level on another.
- The candle that hasn't closed. The last candle on a live chart is still changing; its close is just the current price.
Why it matters
Every other term in this glossary is read from candles: a swing high is a candle's high, a break is a close, a fair value gap is three candles that don't overlap. Knowing what a candle records, and what it leaves out, is the base for all of them.
Common mistakes
- Acting on a candle before it closes. A strong body halfway through the hour can end as a long wick.
- Reading a single candle pattern in isolation. A hammer or engulfing candle means far more at a level you marked beforehand than in the middle of nowhere.
- Assuming the order inside a candle. If a candle touches both your stop and target, check a lower timeframe before deciding what happened.
- Treating colour as trend. One red candle in an uptrend is a pullback, not a reversal. The trend is in the highs and lows.
Questions
What do the colours of a candle mean?
Only whether it closed above or below its open. Most platforms colour an up candle (close above open) green or white and a down candle red or black, but the colours are a setting, not a standard. A long red candle can still be part of an uptrend.
Why do my daily candles look different from someone else's?
Forex trades around the clock on weekdays, so a daily candle depends on when the platform starts the day. Many brokers use 5 p.m. New York time; others use midnight in their server's time zone, which can add a short Sunday candle and give a different open, high, low and close for every day.
Does a long wick mean price will reverse?
Not by itself. A long upper wick says price went higher and was pushed back before the close; where it happens matters more than the wick. At a level you were watching, after a sweep of a high, it is evidence. In the middle of a range it is often just noise.
What is the difference between a candlestick and a bar chart?
Nothing in the data. Both show the same four prices per period. A bar chart draws the open and close as small ticks on a vertical line; a candlestick fills the space between them as a coloured body, which makes direction easier to see at a glance.
Candles in the app
StraviFX reads your chart picture and then checks every level it proposes against numeric OHLC candles fetched for that market, so a level comes from the data, not just from the pixels. The journal uses the same candles to follow each setup to its outcome, and where one candle touches both the stop and a target, it counts the stop: OHLC can't show which came first, and assuming the better order would report a record nobody could reproduce.
Get StraviFX
Point your camera at any chart and StraviFX reads the structure, plans the entry, stop and targets, and sizes your risk. Free to download on Android, with optional subscriptions.