Glossary · Risk
Drawdown
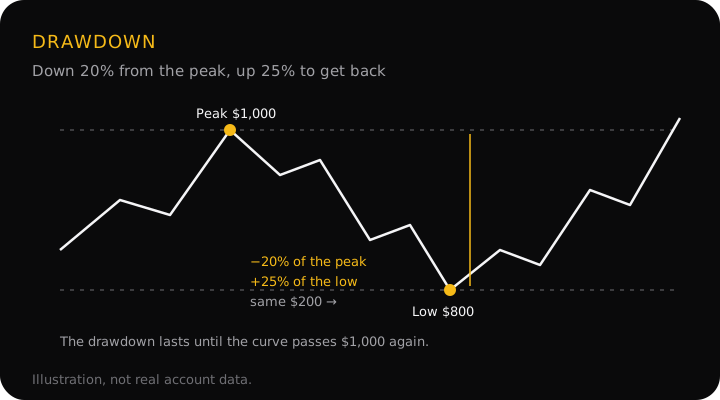
Drawdown is how far an account has fallen from its highest value to the lowest point after it, as a percentage of that peak. It keeps counting until the account makes a new high. Losses compound against you: a 20% drawdown needs a 25% gain to get back, and a 50% drawdown needs 100%.
The two formulas
Drawdown % = (peak − low) ÷ peak × 100
Gain needed to recover = drawdown ÷ (1 − drawdown)
A $1,000 account that falls to $800 is in a 20% drawdown. To get back to $1,000 it needs $200 on $800, which is 0.20 ÷ 0.80 = 25%.
| Drawdown | Gain needed to get back |
|---|---|
| 5% | 5.3% |
| 10% | 11.1% |
| 20% | 25% |
| 30% | 42.9% |
| 50% | 100% |
| 75% | 300% |
A worked example: how a losing streak becomes a drawdown
A $1,000 account takes ten losses in a row, each risking a fixed percentage of the balance at the time. This is arithmetic, not a forecast.
| Risk a trade | After 10 losses | Drawdown | Gain to recover |
|---|---|---|---|
| 1% | $904.38 | 9.6% | 10.6% |
| 2% | $817.07 | 18.3% | 22.4% |
| 5% | $598.74 | 40.1% | 67.0% |
Each balance is $1,000 × (1 − risk)10. At 1% a trade, the account is back above $1,000 after six winners in a row at 1:2 risk-to-reward (1.026 × $904.38 ≈ $1,018; five winners reach only about $998.50). At 5% a trade the hole is four times deeper.
Is ten in a row realistic? At a 40% win rate, any one run of ten trades is all losses only about 0.6% of the time (0.610). Over 500 trades, though, the chance of at least one run of ten losses is about 70%. Plan your risk for the streak you will eventually meet, not the average trade.
What traders disagree on
- Balance or equity. Balance drawdown counts closed trades only; equity drawdown includes open trades' floating losses and is usually deeper.
- From the peak or from the deposit. MetaTrader 4's strategy tester reports three figures: an absolute drawdown (the largest fall below the initial deposit), a maximal drawdown in money and a relative drawdown in percent, both measured from the highest local equity value to the next low (MetaTrader 4 Help: Results). When people say "drawdown" without a word in front, they almost always mean peak to low, as on this page.
- Prop firm limits. Funded-account firms usually set a daily loss limit and a maximum drawdown, but they measure them differently (from the starting balance, or trailing the highest balance or equity). Read your firm's own rules; the same trades can pass one firm's limit and break another's.
Why it matters
Win rate and average R tell you how a strategy makes money. Maximum drawdown tells you what it costs to stay with it. A method that makes money on paper is no use if its normal losing streaks are deeper than you can sit through, because most traders change the rules, or the size, at the bottom. That is the case for a small, fixed position size from your risk: it decides how deep your drawdowns get before they happen.
Common mistakes
- Sizing up to win it back. Ten losses at 1% leave you 9.6% down. Double the risk to 2% and the next ten losses leave you about 26% below the peak.
- Measuring from the deposit only. An account that went from $1,000 to $1,500 and back to $1,100 is still up, but it is in a 26.7% drawdown.
- Ignoring open trades. A balance that looks fine can hide an equity drawdown from positions that are deep in loss without a stop.
- Judging a strategy by win rate alone. Ask for the maximum drawdown and the longest losing streak too.
Questions
What is a good maximum drawdown?
There is no standard figure. The useful question is how deep a drawdown you can sit through without breaking your rules, then sizing so that a realistic losing streak stays inside it. At 1% risk a trade, ten losses in a row cost about 9.6%; at 5%, about 40%.
Is drawdown the same as a loss?
No. A loss is one trade. Drawdown is the whole fall from the account's peak, across every losing and winning trade until a new peak, so several small losses can add up to a large drawdown.
Does drawdown include open trades?
It depends on whether it is measured on balance or equity. Balance drawdown counts only closed trades. Equity drawdown includes the floating profit or loss of open trades, so it is usually deeper. Prop firms and platform reports say which one they use; check before you compare numbers.
How do I recover from a drawdown?
Slowly, and not by trading bigger. Raising the size to win it back faster means the next losing streak starts from a smaller account with bigger positions. Keep risk per trade fixed or cut it, review the losing trades in your journal, and let the recovery take the trades it takes.
Drawdown and the app
StraviFX doesn't calculate your account's drawdown today. What it does is keep each loss to the size you choose: the free lot size calculator sizes from your equity and risk percentage, flags anything above 2% and caps the input at 10%. The journal tracks every setup to its outcome, losses included, so a losing streak is visible while it happens. The lot size calculator on this site does the same sizing for forex and gold.
Get StraviFX
Point your camera at any chart and StraviFX reads the structure, plans the entry, stop and targets, and sizes your risk. Free to download on Android, with optional subscriptions.