Glossary · Risk
Risk-to-reward (R:R)
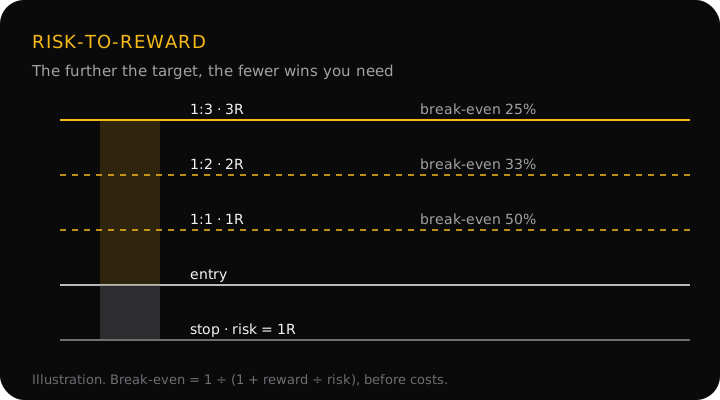
Risk-to-reward (R:R) compares what a trade can lose at its stop with what it can make at its target. Risking 30 pips to make 90 is 1:3: the target is three times as far as the stop. It sets how often you must win to break even, before costs: 25% of the time at 1:3, 50% at 1:1.
How to work it out
R:R = (target − entry) ÷ (entry − stop) for a buy, and the other way round for a sell. Measure both distances in the same unit (pips, points or price), and write the result as 1:x.
Break-even win rate = 1 ÷ (1 + x). At 1:2 that is 1 ÷ 3 = 33.3%: win one trade in three and you are level, before costs. The risk reward calculator does both from your entry, stop and target.
"R" is the same idea in one letter: 1R is the amount you lose if the stop is hit, so a 1:3 target is +3R and a stop-out is −1R. Counting results in R lets you compare trades of different sizes.
A worked example: the ratio is only half the story
One EUR/USD buy at 1.1000 with a stop at 1.0970 (30 pips, 1R). The prices are an illustration, not real data.
| Target | Distance | R:R | Break-even win rate |
|---|---|---|---|
| 1.1030 | 30 pips | 1:1 | 50% |
| 1.1060 | 60 pips | 1:2 | 33.3% |
| 1.1090 | 90 pips | 1:3 | 25% |
| 1.1150 | 150 pips | 1:5 | 16.7% |
The further target needs fewer wins, but it is also reached less often. What decides the result is both numbers together, the expectancy: win rate × reward − loss rate × risk, in R.
- Trader A takes 1:1 targets and wins 55% of the time: 0.55 × 1 − 0.45 × 1 = +0.10R a trade, or +10R over 100 trades.
- Trader B takes 1:3 targets and wins 22% of the time: 0.22 × 3 − 0.78 × 1 = −0.12R a trade, or −12R over 100 trades.
B has the "better" ratio and loses; A has the "worse" one and gains. These win rates are made up to show the arithmetic. Your own come only from a record of your own trades.
What traders disagree on
- Which way round. Risk first (1:3), reward first (3:1), or in R (3R). They mean the same thing when read correctly.
- A minimum ratio, or none. Some skip any trade under 1:2; others accept 1:1 on setups that win often. A minimum is a useful filter, as long as it doesn't tempt you to stretch the target.
- Planned or realised. The planned ratio is what the levels say; the realised one is what you actually got after early exits, slippage and partial closes. Your journal should track both.
StraviFX writes ratios risk first (1:2) and puts the stop and targets at levels on the chart first, then reports the ratio those levels give. It never moves a target to make the number look better.
Why it matters
The ratio turns a chart into a question you can answer: how often does a trade like this need to work? If the nearest real level only pays 1:0.8, you need to be right more than half the time just to stay level, and that is worth knowing before you enter. It also shows when a better entry would fix a trade: the optimal trade entry page works through that case.
Common mistakes
- Moving the target to reach a ratio. A 1:3 target placed beyond a level price rarely passes is a 1:3 on paper only.
- Shrinking the stop to improve it. A stop inside normal noise gets hit more often, so the better ratio is paid for with more losses. Move the entry, not the stop.
- Judging a trade by its ratio alone. As the example shows, a high ratio with a low hit rate can lose.
- Ignoring costs on tight stops. On a 10-pip stop, 2 pips of spread is a fifth of the risk.
Questions
What is a good risk-to-reward ratio?
There is no single good number, because the ratio only means something next to how often that kind of trade wins. Many traders want at least 1:1.5 or 1:2 so that they can be wrong more than half the time and still come out ahead. A higher ratio with a far-fetched target can be worse than a modest one that gets hit.
Is 1:3 the same as 3:1?
Usually, yes. 1:3 is written risk first (risk 1 to make 3); 3:1 is written reward first. Both describe a target three times as far as the stop. Check which way round a source writes it before comparing numbers. StraviFX writes risk first, and also uses R: a 1:3 target is 3R.
Should I measure R:R to the first or the second target?
To whichever exit you actually plan to take. If you close half at TP1, neither ratio alone describes the trade; work out what each outcome pays, as the take profit page does. Quoting the ratio to the furthest target while banking most of the position early overstates the trade.
Do spreads and commissions change the ratio?
Yes. You pay them win or lose, so they add to the loss and take from the win. A 20-pip stop and a 40-pip target with 2 pips of costs is really 22 pips risked to make 38: about 1:1.73 instead of 1:2, and the break-even win rate rises from 33.3% to about 36.7%. The tighter the stop, the more costs matter.
Risk-to-reward in the app
Every StraviFX setup shows the ratio for each target on its execution ladder, next to the distance in pips. On Premium's extended analysis, the first target must be at least 1.5R and the second at least 2R at real opposing levels; if the chart doesn't offer that, you get "no trade" instead, and that analysis doesn't count toward your daily limit. The free performance insights show your win rate by market and timeframe, which you can set against the break-even win rate of the ratios you take.
Get StraviFX
Point your camera at any chart and StraviFX reads the structure, plans the entry, stop and targets, and sizes your risk. Free to download on Android, with optional subscriptions.