Glossary · Indicators
Divergence
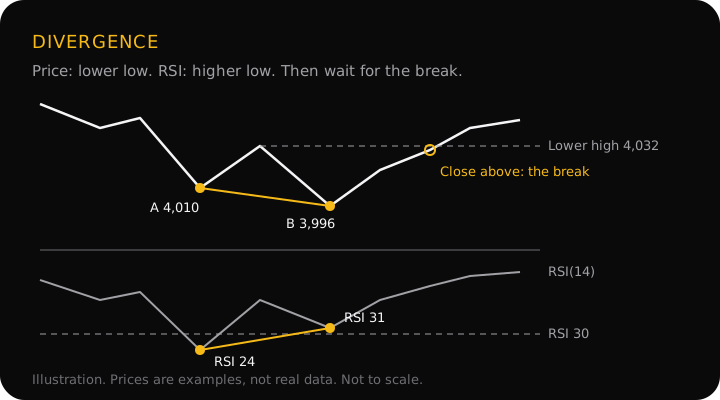
Divergence is when price makes a new extreme but a momentum indicator such as RSI doesn't: a lower low on the chart against a higher low on RSI, or a higher high against a lower high. It suggests the move is losing force. It is a warning, not a timed reversal, and it can repeat several times before price turns.
Regular and hidden divergence
| Type | Price | RSI | Usually read as |
|---|---|---|---|
| Regular bullish | Lower low | Higher low | Downtrend losing force |
| Regular bearish | Higher high | Lower high | Uptrend losing force |
| Hidden bullish | Higher low | Lower low | Uptrend pullback, trend may resume |
| Hidden bearish | Lower high | Higher high | Downtrend pullback, trend may resume |
Always compare swing points with swing points: the two price lows and the RSI values on those same candles. Comparing any two bars you like will find divergence everywhere.
A worked example: gold on the 4-hour chart
The prices and RSI values are an illustration, not real data.
- Swing low A: 4,010.00, RSI(14) 24.
- Bounce: to a lower high at 4,032.00. The downtrend is intact.
- Swing low B: 3,996.00, $14 below A. RSI is 31, higher than at A. That is regular bullish divergence: the second push down went further with less momentum.
- What to wait for: a candle close above the lower high at 4,032.00, the first break against the trend (a change of character). Until then, the downtrend is still the trend.
- If it breaks: a buy near 4,035.00, the stop below B with a $3 buffer at 3,993.00 ($42 of risk per ounce), and a first target at the next lower high above, say 4,098.00 ($63), which is 1:1.5.
Check the size before you get excited. On a $2,000 account at 1% risk ($20), a $42 stop on gold needs 0.0048 lots (1 lot = 100 oz, so $4,200 a lot at the stop), below the 0.01-lot minimum. 0.01 lots would risk $42, 2.1% of the account. The honest choice is to skip it or take the bigger risk knowingly, not to shrink the stop to fit. The position size page walks through the rule.
The version that fails: price never closes above 4,032. It makes a third low at 3,980.00 with RSI at 33, divergence again, and keeps falling. A trader who bought at B on divergence alone is now $16 down with no structure to justify holding, which is why the break comes first.
Why it matters
Divergence shows something the price chart alone hides: that the latest push needed more effort for less result. It is most useful at a level you were already watching, such as a demand zone or a sweep of equal lows, where it adds a second kind of evidence to the first.
Common mistakes
- Trading the divergence instead of the break. Momentum can fade for several swings while price keeps going.
- Comparing bars that aren't swing points. Pick the two clear lows (or highs) first, then read RSI on those candles.
- Fighting the higher timeframe. Bullish divergence on the 15-minute chart inside a daily downtrend is a pullback more often than a reversal. See timeframe alignment.
- Repainting tools. Some divergence indicators draw their lines only after the second swing is confirmed, then look perfect in hindsight. Judge them on how they looked at the time, candle by candle.
Questions
Is divergence a buy or sell signal?
Not on its own. It says the latest push had less momentum than the one before, which often happens late in a move but can also happen in the middle of one. Use it as a reason to watch for a break in structure, and enter on that break, with the stop where the idea is proven wrong.
What is the difference between regular and hidden divergence?
Regular divergence compares the extremes of a trend (lower low in price, higher low on RSI) and hints at a reversal. Hidden divergence compares the pullbacks inside a trend (higher low in price, lower low on RSI) and is read as a sign the trend may continue. The names vary between sources; some call regular divergence classic.
Which indicator is best for divergence?
RSI is the most common, and MACD and the stochastic are used the same way. They are all built from the same closes, so finding divergence on two of them at once is close to finding it twice on one. Pick one and stay consistent.
Which timeframe should I look for divergence on?
On whichever timeframe you are reading structure. A divergence on the 4-hour chart between two clear swing lows means more than one on the 5-minute chart, where small swings produce it constantly. Check the higher timeframe trend too: divergence against a strong daily trend fails often.
Divergence in the app
When an analysis in StraviFX mentions divergence, the word links to the app's glossary, which defines it the way this page does: weakening momentum, not a timed reversal. Every plan is still built on a structure read, with an entry, a stop loss at the level that proves the idea wrong and two targets, and the answer can be to stand aside.
Get StraviFX
Point your camera at any chart and StraviFX reads the structure, plans the entry, stop and targets, and sizes your risk. Free to download on Android, with optional subscriptions.